Optimize your Ruby on Rails CI pipeline
Recently I’ve noticed that a short pipeline - one that consists of only few hundred tests takes about 5 minutes to finish. I’ve quickly checked how the situation looks in some bigger projects that I’ve contributed to and discovered that the average goes to approximately 10 minutes.
Thought that maybe those projects are exceptions so I’ve checked if there are any statistics on this topic - and yes, there are. And what’s worse - they seem to prove my observations.
There must be a room for improvement, right? After quick searching I’ve found out that there is not too much on this topic. I’d truly recommend you the two articles wrote by Steph Skardal:
She shared a lot of useful insights, but, the topic is so wide that there is definitely more to say. Since I started working on optimizng my pipelines I’ve found that every topic could deserve a separate article. I decided to document all of my findings from the few projects I’ve worked on and optimized the pipeline there.
Side note: I gave a presentation about this topic at Poznan Ruby User Group, you can find it there.
Why spend time on optimizing CI?
There are a few main points:
- It increases your iteration speed - the faster you can iterate the more you can learn
- Faster iteration = shorter feedback loop
- Successful companies like Facebook puts emphasis on Move fast and break things mantra. Some of you might think that breaking things isn’t the right thing to do, but in fact, learning through experiments is very effective. The gotcha is there that we want to discover the failure as soon as possible.
- For ones who prefer number arguments: According to Kelly Sutton’s blog - Gusto lands 2% more Pull Requests per engineer per week for each minute of CI time improvement.
Navigation
It’s the longest post I’ve ever written and reading it as a whole might be difficult. I’d recommend using the anchor links from the next two sections that will send you straight into the info about subject/technology of your interest.
I’ve tried to order the solutions from the ones that are the easiest to implement, to the more complex ones, however at some point it becomes impossible to distinguish the difficulty.
What is slowing down the pipeline?
There are numerous reasons why it could be slow, each case might(and likely will) be different but here I will try to address the most common scenarios that I met in my work:
- Configuration problems
- Unefficient cache usage
- Feature/integration tests
- Slow API requests to 3rd party services
- Slow test suite
- Unefficient parallelization
Technologies I have used
Every application might need a different strategy as there are different slowing factors. Oftentimes we could locate the slowness in area of specific library. I am spending some time talking about:
- RSpec - Profiling
- Github Actions - Caching, Self-hosted runners
- Capybara - Integration Tests
- Webpacker
- Puffing Billy as a Request Proxy
- Parallel tests gem
Solutions
Note: You wont find any numbers like “this change will speed your pipeline by X%” as I can’t guarantee what will work for you and what will be the impact. I’ve done my research on multiple projects and the results varied.
1. Check your configuration
My to-do list whenever I start working on a new project. Going through all of the points takes only a few minutes but gives basement for future work:
- Set DB cleaner settings to use transaction strategy: it’s not possible for all projects to use this strategy, but it is the fastest one referring to the Database Cleaner gem homepage.
- Organize gems into Groups in
Gemfile: if you aren’t leveraging Gemfile groups then you are loading some unnecessary Gems every pipeline run. Usually, it’s blazing fast to load the gems from the cache and it won’t make a huge difference, but overall, it’s always a good idea to have a clean Gemfile. - Organize your
dependenciesanddevDependenciesinpackage.json: thenode_modulesfolder often grows to enormous sizes, so it’s worth checking if you need to load everything. - Disable logging in the CI environment or log only fatal messages: if you aren’t using artifacts to publish pipeline logs then it’s a no-brainer to disable them or use only the
fatallog level:# config/environments/test.rb config.log_level = :fatal - Check Postgres health check settings:
# .github/workflows/your_workflow.yml
services:
    postgres:
      image: postgres:11
      ports: ["5432:5432"]
      options: >-
        --health-cmd pg_isready
        --health-interval 2s
        --health-timeout 2s
        --health-retries 8
It’s worth increasing the retries amount and lowering the interval time as you don’t want to waste any time waiting for the next retry.
- Use
rails db:schema:loadinstead ofrails db:migrate: running the migrations for a test database might be redundant, even though migrating an empty database is fast, running hundreds of migrations always take some time. If you have an up-to-dateschema.rbfile I’d consider dumping it.
2. Utilize Caching
Your pipeline is usually a Docker container. It means that it has to set up the whole environment from scratch for each run. Doing the whole setup every time would take ages without caching.
GitHub Actions caching saves the files you frequently use under a unique key and allows you to restore the files from that key at high speed. Cache is utilized the most at loading your project dependencies, but you might not even notice it as it’s done automatically in the most popular actions: setup-ruby or setup-node.
What other files we might want to reuse between runs?
Whatever is your answer, I’d recommend you to go into your repository and check if you are caching those files.
The first thing that comes to my mind is:
-
Cache your Webpacker files… properly
Note: I’ve worked with Webpacker in this example, but a similar approach could be used for other libraries processing the assets. It only applies when you are using feature/integration tests.
Feature tests are recompiling your assets after any change to CSS or JS files.
You might not notice it on your local machine as it usually takes only a few seconds there. But the runners used by GitHub Actions are way slower. To the degree that you shouldn’t be surprised if the asset precompilation takes minutes.
The essential part is “after any change”. It means that we could avoid assets compilation when there are no changes to our assets, right? You don’t want to recompile assets on CI when it’s running for pure back-end changes.
For any project using Webpacker(or now Shakapacker) I have prepared proper cache action, just add it before asset precompilation in your workflow:
 - name: Get Webpacker cache key
   id: get-webpacker-cache-key
   run: |
     echo "::set-output name=key::$(bin/rails r 'print Webpacker::Instance.new.compiler.send(:watched_files_digest)')"
   shell: bash

 - name: Cache precompiled assets
   uses: actions/cache@v3
   with:
     path: |
       public/packs
       tmp/cache/webpacker
     key: $-assets-$
     restore-keys: |
       $-assets-
It’s getting
digestfrom your Webpacker configuration which is a unique identifier of the current state of your Javascript files. If any of the files would change then thedigestwould be also different, forcing the CI to recompile assets. For a knowndigestthe precompilation will be skipped as all of the files will be loaded from cache.It’s also worth mentioning that you should always cache the
public_output_pathdefined inconfig/webpacker.ymlfile.I’ve seen multiple projects where it wasn’t done properly which cost hours of additional asset precompilation that could be avoided.
Last note there: Some people tend to not put explicitly
rails assets:precompilein the CI configuration asrails testorrspeccommand will compile the assets anyway. However, I find it useful to have a separate pipeline step for asset precompilation. This way the precompilation won’t pollute the time results of your test action.
Did you know the difference between GitHub Actions cache and artifacts?
| Cache | Artifacts |
|---|---|
| Internal Storage | External Storage |
| Save precompiled assets, node modules | Save test coverage, logs |
| Shared between runs | Not shared between runs |
| Deleted when unused for 7 days | Deleted after 90 days(or specified in retention options) |
3. Integration Tests
Integration tests are usually requiring a full boot of your application to expose it to the web browser that will perform automated actions in the app. Using the browser is usually slow on weak machines from your continuous integration provider. But there are few things we can do about it:
-
Use Chromedriver command line switches:
# Usually it'd be configured this way somewhere in your test folder chrome_options = Selenium::WebDriver::Chrome::Options.new chrome_options.add_argument("--headless") chrome_options.add_argument("--disable-gpu") chrome_options.add_argument("--blink-settings=imagesEnabled=false") Capybara::Selenium::Driver.new(app, browser: :chrome, capabilities: [options])--disable-gpu: Github Actions runner doesn’t have GPU so we should tell Chrome not to try using it for page rendering, that might be the biggest difference maker from all 3--no-sandbox: is making sure Chrome sandbox mode isn’t used as it’s not needed in the CI environment--blink-settings=imagesEnabled=false: as long as you aren’t running visual regressions tests it should be safe to disable image render.There are literally thousands of those switches, if you want to optimize your tests by changing the browser behaviour there are high chances there is an switch for it.
-
Check your
Capybara.default_max_wait_time:There is no correct wait time, but in most cases, it should be no longer than a 5-10 seconds, for special cases it’s possible to use such blocks in your tests:
using_wait_time x do # where x is the number of seconds # Test logic goes here end -
Use request proxy - Puffing Billy
Feature tests are usually loading a lot of 3rd party stuff like tracking scripts, google fonts or any other unrelevant for our test environment stuff. If you think:
“I do have WebMock blocking internet connections. It’s not for me.”
You are wrong. WebMock can’t block requests done by the browser in feature tests, Puffing Billy on the other hand can. Moreover, besides blocking unwanted resources it could also cache any relevant front-end-side requests.
It takes a good amount of time to set up it in a way that everyone benefits from it, especially in large projects. But being used properly is a powerful tool.
Setup
Add proxy server to your driver initialization:
chrome_options.add_argument("--proxy-server=#{Billy.proxy.host}:#{Billy.proxy.port}")Configure Billy:
  # spec/rails_helper.rb
  Billy.configure do |c|
    c.cache = true
    c.persist_cache = true
    c.cache_path = "spec/req_cache/"

    c.non_whitelisted_requests_disabled = true
    c.ignore_params = [ # Do not match request parameters
      'https://maps.googleapis.com/maps/vt',
      'https://widget.trustpilot.com/stats/TrustboxImpression',
      ...
    ]
    c.cache_request_body_methods = [] # Do not match POST request body
  end
You could add your cache_path to
.gitignorefile and add pipeline caching to this folder. Or - it’s less elegant approach in my point of view: store all of the cached requests in your repository. The latter allows you to benefit from Puffing Billy also in your local environment.
4. Optimize Test Suite
-
Profiling
No matter how performant will be our configuration, if our tests are extremely slow then we won’t see a big improvement.
As a starting point, I’d use
rspec --profilecommand that will show us the 10 slowest examples and also the test groups. But the--profileflag is only scratching the surface there.Test-prof gem
To obtain valuable metrics I recommend to everyone the test-prof gem as it seems to be an extremely powerful tool for benchmarking and optimizing our test suite. There is a great article from the gem homepage describing most of the use cases.
If you are concerned about shortening your feedback loops then learning at least the basics of
test-profis a must!A small cheatsheet of commands described in the articles:
  TAG_PROF=type rspec # find out which type of tests is the slowest for you

  FDOC=1 rspec # highlight possible usages of factory `build` instead of `create`

  FPROF=1 bundle exec rspec # number of times each factory is called

  EVENT_PROF="factory.create" bundle exec rspec # time spent on factory creation

  TEST_STACK_PROF=1 rspec && stackprof tmp/test_prof/stack-prof-report-wall-raw-total.dump # where the most time were spent in terms of called classes

  EVENT_PROF=sidekiq.inline rspec # check whether sidekiq worker executions aren't slowing you tremendously
Learning how to profile/benchmark my test suite with
test-proftook me around 20 minutes, insights I’ve got are likely going to save me hours in long run. It’s definitely one of the highest-leverage activities I did recently.
-
Flaky tests
A test would be considered “flaky” once its result isn’t deterministic. Maybe it’s waiting for external service and timeout from time to time? Or it fails when the order of running the tests is different?
I’d consider that a flaky test is basically a failing test. The immediate action could be to mark every unstable example as skipped with proper comment.
Sometimes finding out why our tests are flaky isn’t a friendly task and could take a good amount of time. Having a test that could give us false positives might be even worse.
Some projects will use gems like
rspec-retryto make sure the pipeline success even with flaky tests. But retrying the examples takes time so it’s definitely a good idea to take action.
Advertisment
Every organization would benefit from a fast and efficient pipeline. It makes your programmers happier by having more time, and being able to work on the things that matter.
I am a consultant and my passion is optimizing processes. I will do my best to bring value to your project. If you find my research and knowledge useful…
5. Parallelization
Parallelization is the last step as without adding all of the configurations tweaks and no proper cache usage - it will only spread the slowness of your pipeline to multiple machines.
Things to know:
-
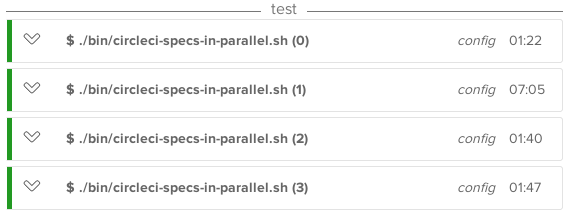
Our goal should be to always have all of our pipelines running for a similar amount of time. The situation when one chunk of tests is executed
2 minutesand another one takes5 minutesis something we want to avoid. In the given example ideally, both actions take around3 minutes.We want to avoid such situation:
and achieve something like:
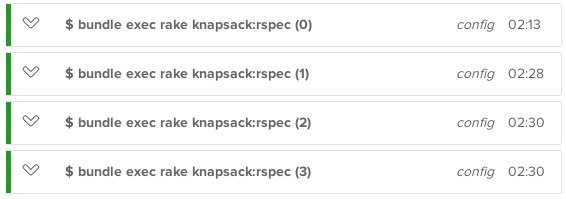
Screenshots from Knapsack documentation.
-
The configuration for each pipeline action shouldn’t take longer than the length of test run action. Otherwise, it might be a signal that we’re over paralyzed ;)
Meet Parallel_tests gem
- Automatically splits tests into groups
- Generates file runtime stats for all tests*
- *we have to somehow provide the runtimes file to CI
- Easy to scale
If you are using Minitest then you should be able to use built-in this Gem concurrency: read more.
RSpec users - keep reading.
Setup:
- Add TEST_ENV_NUMBER to your database configuration
- Start your tests with command like:
parallel_test spec/ -n $NO_GROUPS --only-group $GROUP --group-by runtime - Github Actions setup:
strategy:
    fail-fast: false
    matrix:
    ci_node_total: [4]
    ci_node_index: [0, 1, 2, 3]

- name: "Run tests"
    env:
        NO_GROUPS: ${ { matrix.ci_node_total } }
        GROUP: ${ { matrix.ci_node_index } }
    run: bin/parallel_test spec/ -n $NO_GROUPS --only-group $GROUP
I am about to write a full article on setting up and using Parallel_tests so let me leave only the basic configuration there and once the article is fully baked I will add the link to it there.
6. Self-hosted CI runners
GitHub-hosted runners are great as they work out-of-the-box, but there is one main drawback: it have only a 2-core CPU and 7GB of RAM and you have no control over it. 7GB of RAM is plenty for majority of Rails applications, but the weak CPU is usually the bottleneck.
GitHub is experimenting with larger runners but it’s currently in beta and available only for those using GitHub Team or GitHub Enterprise Cloud plans.
If you really want to speed up the pipeline there is an alternative - self-hosted runners. Those will allow you to use bulkier machines, which obviously would positively affect the pipeline speed.
It might be a great option if you already have a beefy computer for computation in your company. The one-machine setup is simple and you can read it here.
But in most cases you’d want to run multiple runners to support the parallelization, right? Thanks to Actions Runner Controller it’s relatively straightforward to configure your Kubernetes cluster to autoscale with self-hosted runners.
For more info on how to setup self-hosted runners, I recommend you read Sander Knape article and this one written by 10Clouds.
You made it to the end, thank you!
I encourage you to leave any feedback, maybe you know other optimization methods? Do you disagree with something? I am happy to discuss and update the article accordingly!
Recent posts:
Master Git tools - Effective Programmer pt. 2
Learn about the importance of writing a good commit messages. How to use message templates, hooks, aliases and how to navigate Git history like a pro.
Read More
Taking notes for productivity - Effective Programmer pt. 1
Organizing knowledge is a key factor of effective programming work. Is taking notes the perfect way to do it? I think yes answering all of the why and how questions.
Read More
How to deploy multiple Rails apps on a single server with Capistrano
Almost everyone uses cloud hosting solutions like Heroku or AWS nowadays(and I don’t expect it to change even after this DHH post). But if you still self-host your apps then Capistrano would be well known to you.
Read More
Master Git tools - Effective Programmer pt. 2
Taking notes for productivity - Effective Programmer pt. 1
How to deploy multiple Rails apps on a single server with Capistrano
Almost everyone uses cloud hosting solutions like Heroku or AWS nowadays(and I don’t expect it to change even after this DHH post). But if you still self-host your apps then Capistrano would be well known to you.